The best penalty takers of all time
How many times did you search for ‘the best penalty takers of all time’ in Google and then clicked one disappointing article after another. Yeah, thought so. Well, this is an article about the best penalty takers of all time, so let’s hope it is less disappointing.
The following analysis is based on the methodologies used in this series by David Robinson (@drob on Twitter) and in this article by @OMalytics.
Data
Finding reliable data about penalties is very difficult. The best that you can have are very limited lists (usually top 10 lists) of top penalty scorers for national leagues or important competitions like the World Cup. What makes it very difficult to have penalty data is that, even though penalty goals are well documented and somehow easier to be tracked, data about missed penalties are very scarce. I initially thought to use data from Transfermarkt but I was pointed out on Twitter (and then verified myself) that their data are wrong.
In any case, one day I abandoned English and thought to goggle ‘i migliori rigoristi di tutti i tempi’, which is ‘the best penalty takers of all time’, in Italian (it is nice that Italians have a specific word for the player who takes penalties: rigorista). The search was successful, as I found an impressive penalty database, probably at the least expected website. There is this general blog Sdoppiamo Cupido (!!!), where two people, Angelo Vigorita and Federico Morano, worked for years (and are still working) to compile a list of the players with most taken penalties in their career, specifying both scored and missed penalties. Impressive, really! The list can be found here. Other topics that this blog covers are: cold fusion, modeling, music and song lyrics (!!!).
If you navigate through this list and through the comments sections of related articles, you could have an idea of the work invested on it. I took this list, completed it a bit with data about recent players (data about them are way easier to be found) and that is the dataset I have used in the following. It includes the vast majority of the most frequent penalty takers in the world but it most likely is not exhaustive, since it is concentrated on relatively known players playing in Europe and South America. Maybe some excellent penalty taker played in some not well known league and we just do not know. So, consider this as an article on the best penalty taker in the world from those who are somehow considered as well known players.
The authors of the database also emphasize that for some players it was impossible to find data about missed penalties. This includes players like Romario, Zico, Enzo Francescoli, Socrates, Puskas, etc. These players are excluded from the following analysis, unfortunately.
Data exploration
Let us initially have a look at the data we have. In total we have 12,649 penalties, taken by 484 players. Total and scored penalties for each player are shown in Fig-1.
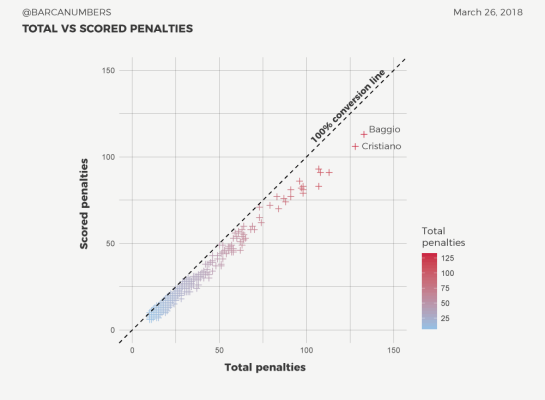
Fig-1
The basis of the analysis is the conversion rate, which is a very basic parameter that shows the ratio between scored and total penalties for each player. It obviously takes values in the 0.0 – 1.0 range and normally, the higher the conversion rate for a player a better penalty taker he is. Out of 12,649 penalties in our database, 10,402 were scored, giving a conversion rate of 82.2%. The number of total penalties and the respective conversion rate for each player is shown in Fig-2.

Fig-2
Although conversion rate is a valid indicator, we cannot directly use it to ultimately compare and evaluate penalty takers. This because for the majority of the players we have scarce data, since they took a relatively small number of penalties (Fig-3) and their average conversion rate is not representative.

Fig-3
The obvious problem here is that it is very tricky to compare different proportions. E.g. who is better, a player who scores 9 penalties out of 10 or one who scores 36 out of 40? Also, how do we compare a player who has scored 10 out of 10 total penalties to one that has scored 98 out of 100? We can use the conversion rate for each player as a comparison criterion but we know that something is not right. We need to transform it a bit.
Transformations
In order to have a more representative metric for a player’s ability to score penalties, we need to transform (improve) the penalty conversion rate. This transformation includes two aspects:
- Firstly, we take into account that some players have taken considerably less penalties than others (Fig-3). We do this by using empirical Bayes estimation, as a method to improve the average penalty conversion rate for each player. Initially we model the conversion rates of our dataset as a beta distribution, which we consider as a prior distribution (Fig-4) and then we combine this prior distribution with the individual data of each player (number of total and scored penalties) to get an updated estimate of the conversion rate.
- Secondly, we take into account the fact that better penalty takers take more penalties. This can also be observed from Fig-2, where conversion rate tends to be higher in players with more total penalties. This is a problem because it makes us overestimate players with few penalties and to underestimate players with a lot of total penalties. To address this issue, we will use beta-binomial regression, a technique that basically incorporates the number of total penalties in building the prior distribution.

Fig-4
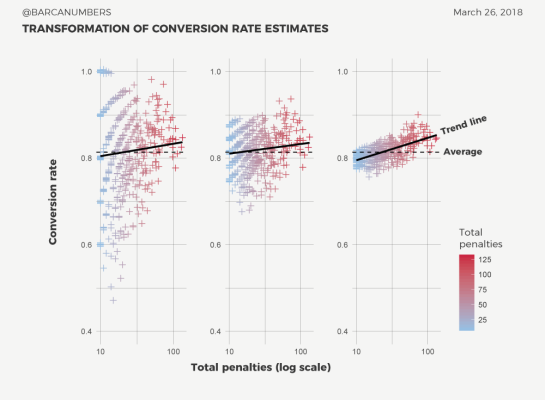
Fig-5
The two above-described transformations are illustrated in Fig-5. From left to right we have:
- 1st graph: initial estimation of conversion rates,
- 2nd graph: conversion rates after combining prior distribution to each player’s data,
- 3rd graph: conversion rates after taking into account the number of total penalties by each player.
From Fig-5 we can see that what we basically did was moving all conversion rate estimates towards the average trend line by narrowing the initial range of conversion rates into a new one. As you may notice, not all players are uniformly influenced by this procedure. Players with a relatively large number of total penalties tend to be less affected, following the logic that for them the initial conversion rate is much more representative.
We need to emphasize that all this analysis is based on the assumption that all the penalties are the same, i.e. they are taken under the same conditions and the probability to convert penalties into goals is the same. This is not true, of course, but it is an acceptable assumption to be made. Some of the factors that influence the difficulty scale of a penalty are: the quality of the goalkeeper; game state and situation; psychological factors; weather conditions; etc. We are neglecting all these factors.
Results
The approach that we followed in the previous section allows us to build a probability distribution of the conversion rate for each player. These are called posterior distributions and are created by combining the prior distribution with the individual data (what we previously discussed). Let us take few examples.
Fig-6 shows the conversion rate distribution for Roberto Baggio and Lionel Messi compared to the prior distribution of all players. What Fig-6 tells us is that Baggio is probably a better penalty taker than Messi (Baggio’s curve is on the right). It also tells us that Messi is a worse penalty taker than the average of the players included in the dataset (his curve is on the left of the dashed curve). Baggio’s curve being higher and narrower simply shows that he took more penalties (133) than Messi (107). Actually, Baggio is the player with most total penalties in the dataset, followed by Cristiano Ronaldo (128) and Totti (113).

Fig-6
Fig-7 shows another example of comparing conversion rate distribution curves featuring Mat Le Tissier, Diego Armando Maradona and Marek Hamšík.

Fig-7
These distribution curves enable us to compare penalty takers to each other but, sometimes, such comparisons are visually difficult to be made, especially if we have more than 3 players (curves). One way to avoid this is by building credible intervals for each player. They show the range of values within which a player’s conversion rate lies with a certain predefined probability (this predefined probability can be set to 90%, 95%, 99%, etc). Fig-8 shows the median conversion rate and the 95% credible intervals for the top ten and bottom ten penalty takers (out of 484 players in our database).

Fig-8
According to this analysis and to the dataset we have used, Cuauhtémoc Blanco (71 scored out of 73 total penalties) is our best penalty taker. If you don’t know who he is, click here for some magic. Blanco is followed by Graham Alexander (77/83) and Matt Le Tissier (49/50). The three worst penalty takers are Marek Hamsik (7/15), Marino Perani (10/19) and Edin Džeko (7/14).
A more complete list of the top 100 penalty takers is shown in Fig-9. Maybe you can find your favorited player there.
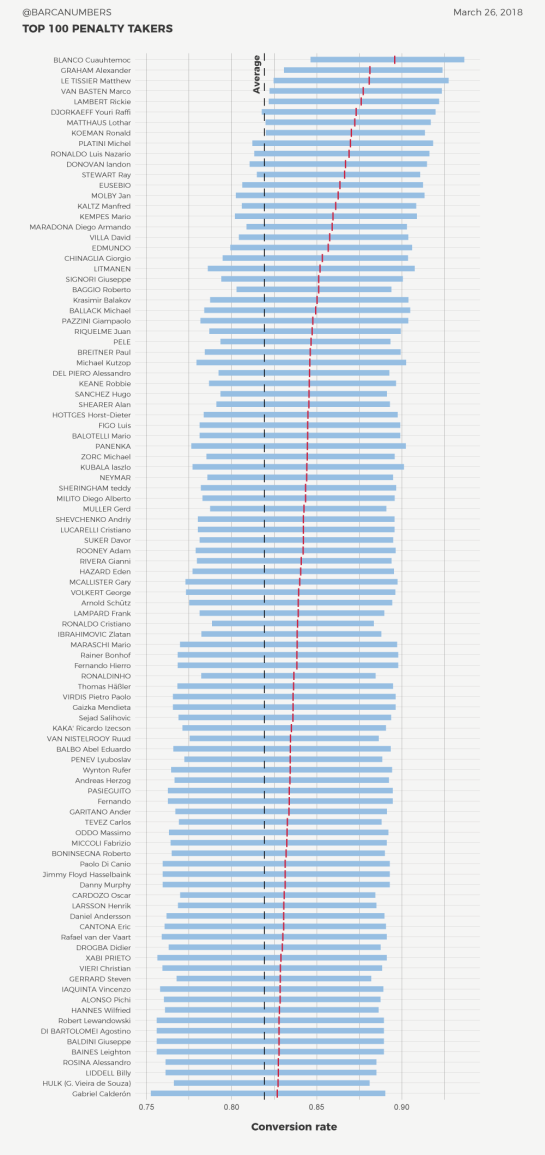
Fig-9
Another way of using each player’s conversion rate probability curves is by calculating the probability that one player is a better penalty taker than another. For example, if we refer to Fig-6, we can calculate that there is 87.1% probability that Baggio is a better penalty taker than Messi. Also, according to our results, we can say that Blanco is probably the best penalty taker in the world, but we cannot say that with absolute certainty. What we can say is that, from all the players we have considered and according to our methodology, Blanco has the highest probability of being better than the rest (around 66% probability that he is a better penalty taker than Alexander and Le Tissier (and so on).
As a conclusion, if my World Cup would depend on one final penalty, I would let Cuauhtémoc Blanco take it.

Reblogged this on Utopian Football.
LikeLike
I know data availability would prevent it, but I’d be interested to see whether a deeper categorisation than simply scored/missed would throw up anything different. Penalties can be scored, they can be missed off target, they can be missed on target (saved), they can be scored from a rebound from a save and they can be scored from a rebound from a miss (post/bar). By differentiating between on and off target misses, you’d go some way towards accounting for goalkeeper skill at least.
LikeLike
What about Penalty assists (Leo to Suarez) for example?
LikeLike
Pingback: Weekly Sports Analytics News Roundup - March 27th, 2018 - StatSheetStuffer
I would say Le Tissier (49/50) is much better than Graham Alexander (77/83) and a little better than Blanco (71/73).
LikeLike
Pingback: Cuauhtémoc Blanco el mejor cobrador de penales en la historia – America Y Ya
What about Raul Jimenez from México ? I think he has never failed a penalty.
LikeLike
Pingback: LEGENDARIO | Cuauhtémoc Blanco fue reconocido como el mejor cobrador de penaltis de la historia
Pingback: ¿Por qué Donovan y Villa son los más fiables del mundo tirando penaltis? – Noticias
Pingback: ¿Por qué Donovan y Villa son los más fiables del mundo tirando penaltis? – Tribuna Liberal
Pingback: Os maiores cobradores de pênaltis em todos os tempos – Blog do Otávio
Pingback: The greatest penalty kick takers of all time – Blog do Otávio
Why Romario isn´t in your sample?
LikeLike
I remember seeing Cuauhtémoc always asking to shoot the penalty. I don’t remember seeing him failed once (apparently he did!). Many times his penalties scores happened during stressful situations such as championship games, playoff (his goal tying a game or being the winning game), world cup, international FIFA club or nation’s tournaments. Like you if my world cup title defended on one penalty shot I would choose Cuauhtémoc for he doesn’t choke even in very stressful situations… Unlike Roberto Baggio back in 1994 when Italy lost to Brazil in the final. He dicho!!!
LikeLike
Where are you gathering al the data from? I would like to do similar Machine Learning projects on Messi’s free kicks. .
LikeLike
Pingback: Το κρισιμότερο πέναλτι της ζωής μου - AthleteStories
Pingback: Pigeon Post – The Outfield
Pingback: Chi sono i rigoristi migliori della storia del calcio? - Calcio Republic
Pingback: Ο Σέρχιο Ράμος θα πάρει μόνος του αυτόν τον τίτλο | KateriniSport.gr